
Exploration 12: Write-Up
Spreadsheets in Excel:
Spreadsheets, specifically in Excel, offer many benefits within the realm of mathematics. Excel spreadsheets allows one to store, categorize, and sort through large amounts of data (qualitative and quantitative) with ease. In addition, calculations can be made quickly, which allows students to make observations and explore the mathematics of particular functions.
For instance, let’s take the function:
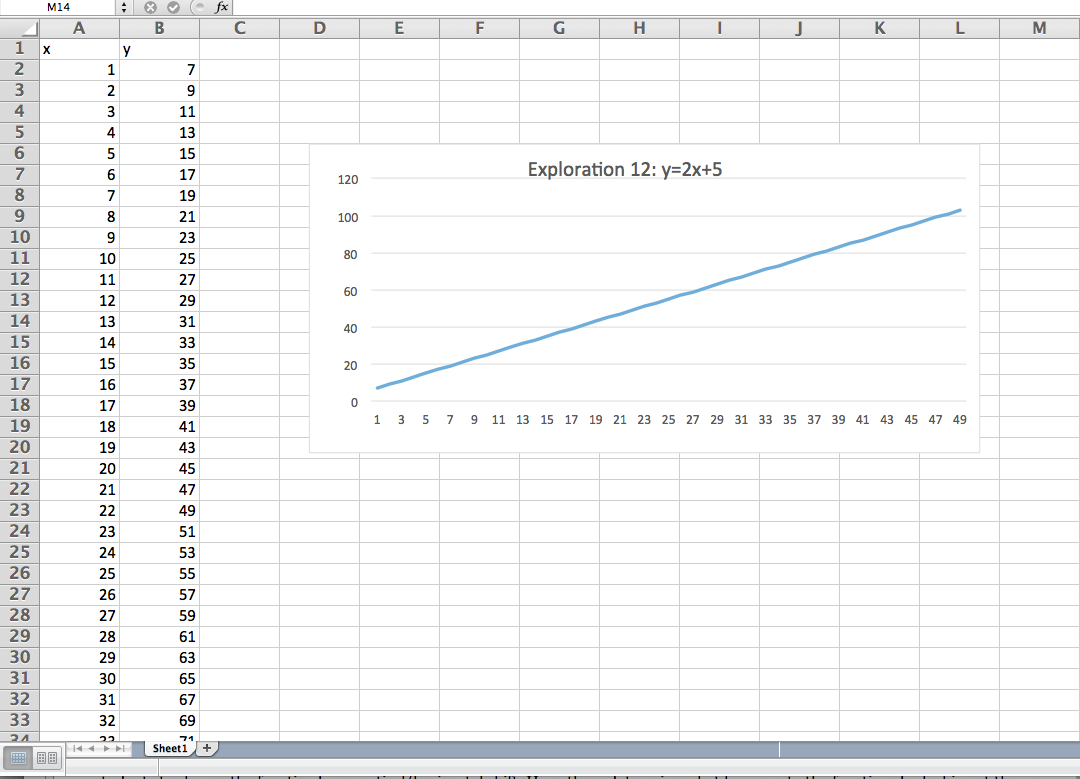
Within excel, we can create a spreadsheet that will take a list of x- values, input them into the function, and provide the corresponding outputs.
Steps to graphing this function in excel:
Establishing the inputs:
- Start by naming the first column

- Place any number in the first entry of the X-column.
- Now, in the second entry of the X-column, click the
 button.
- In the input bar input the following “=SUM (A2, 1)” This takes the first x-value and adds one.
- Click the cell A3 and drag it down as far as you’d like. This extends the formula
Establishing the outputs:
- Start by naming the second column

- Click on cell A2 and then click the
 button.
- In the input bar input “=PRODUCT (2, A2)+5”
- Just like step 5 for the inputs, click cell A2 and drag it down as far as you’d like. This will extend the formula to create the corresponding output for each input.
Creating the Graph:
- Highlight the second column (the y-values)
- Click Insert
 Chart
Chart  Line Chart
  Line
Line
- A graph will then appear on the sheet. It can then be edited to alter the aesthetics of the graph and how the information is displayed.
Pedagogy:
There are many interesting ways to utilize spreadsheets in the classroom. Below are a few ideas that I thought of.
- Give students x and y values. Have them create the graph, and then have the students determine the function. This will help them make sense of numbers in a table and the features of a graph.
- Have students compare functions. Given a function, students will produce a table of values and its corresponding graph. Then allow the students to change the function by a vertical/horizontal shift. Have them determine what happens to the functions by looking at the new values created and the differences in the graphs.
- Give students a set of data and allow them to determine which graph provides the best aspects to interpret the data. Students will determine each graphs features and should be able to justify why they chose to use the graph and what they leaned about the data.
Return to Nick's Homepage